The Parable
A traveler continues his journey.
This time, he notices markers along the road.
Some are tall. Some are short. Some feel calm.
Others feel chaotic.
Each marker tells a story about what happened during that stretch of the path.
Not where he’ll end up. Not what comes next.
Just what actually happened while he was there.
The traveler realizes something important:
If he ignores these markers, every stretch of the road feels random.
If he understands them, the journey starts to make sense.
What This Reveals
A chart is not one continuous line.
It is broken into moments.
Each moment records:
- Where price started
- Where price moved
- Where price finished
- How much struggle happened along the way
Those moments are called candles.
Not because they predict the future.
But because they record the truth of what happened.
What a Candle Represents (In Plain Language)
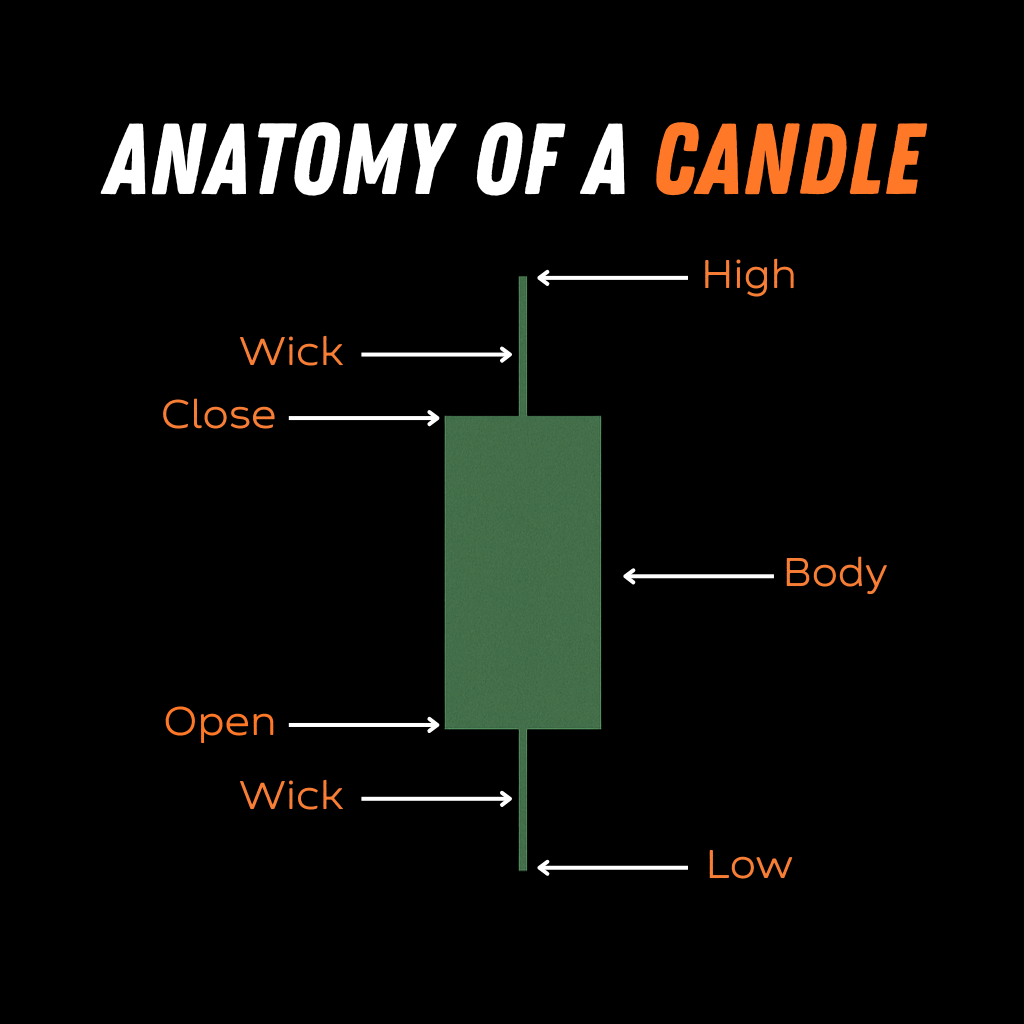
A single candle shows four simple things about price during a period of time:
- Where price opened (where it started)
- Where price closed (where it finished)
- The highest price reached
- The lowest price reached
The thick part of the candle is called the body.
- It shows the distance between where price started and where it ended.
- The thin lines above and below the body are called wicks.
A wick shows how far price moved before being pushed back.
- The top wick shows how high price tried to go
- The bottom wick shows how low price tried to fall
Think of wicks as attempts.
Price (Buyers) tried to move higher.
Price (Sellers) tried to move lower.
The wick records how far those attempts went before stopping.
That’s all a wick is. No signal. No prediction.
Just a record of effort and rejection.
Why Candles Matter
Without candles:
- Price looks like noise
- Movement feels random
- Emotion fills the gaps
With candles:
- You can see effort
- You can see hesitation
- You can see pressure build and release
Candles don’t tell you what will happen.
They tell you what did happen.
Understanding always starts there.
The Common Beginner Mistake
Most beginners:
- Treat candles like signals
- Try to predict with them
- Rush to name patterns
That comes later. Right now, candles are not tools. They are language.
And before you speak a language, you learn to recognize its letters.
The Practice (Do This Today)
Open the same Bitcoin chart you used yesterday.
(https://in.tradingview.com/chart/?symbol=CRYPTO%3ABTCUSD)
Don’t add anything. Just look at the candles.
Notice:
- Some bodies are large
- Some bodies are small
- Some wicks are long
- Some candles barely move
Don’t label them. Don’t Google names.
Don’t interpret. Just observe.
What Comes Next
Tomorrow, we’ll talk about time.
Why the same candle can mean very different things depending on how long it represents.
For now, remember this:
Candles are not predictions. They are records.
Understanding starts with seeing what actually happened.
This content is for educational purposes only and reflects general market concepts. It is not financial advice.

Leave a comment