
The Parable
A traveler sets out on a long journey with a valuable map in his hands.
He believes in the destination. He trusts the map’s importance.
But he never learns how to read it.
When the road bends, he panics.
When the terrain changes, he asks strangers where to go.
The map was never the problem.
His understanding was.
The Truth This Reveals
Bitcoiners talk about sovereignty, conviction, and long-term vision.
But many never learn the language of Bitcoin’s chart.
They hold the asset.
They believe in the mission.
Yet they outsource understanding to headlines, influencers, and emotion.
A chart is not a prediction tool.
It is a record of reality.
And reality should never be outsourced.
The Translation to Charts
A Bitcoin chart is simply price over time.
Nothing more. Nothing mystical.
Every movement reflects:
- Decisions being made
- Pressure building or releasing
- Agreement and disagreement between buyers and sellers
The chart is the map.
Learning to read it is learning to see what is happening, not guess what will happen.
The Common Beginner Mistake
Most beginners think charts are:
- Too complex
- Only for professionals
- About predicting the future
That belief creates dependence.
The truth is simpler:
Charts are learned the same way any language is learned — one word at a time.
The Practice (Do This Today)
Open a Bitcoin chart.
(https://in.tradingview.com/chart/?symbol=CRYPTO%3ABTCUSD)
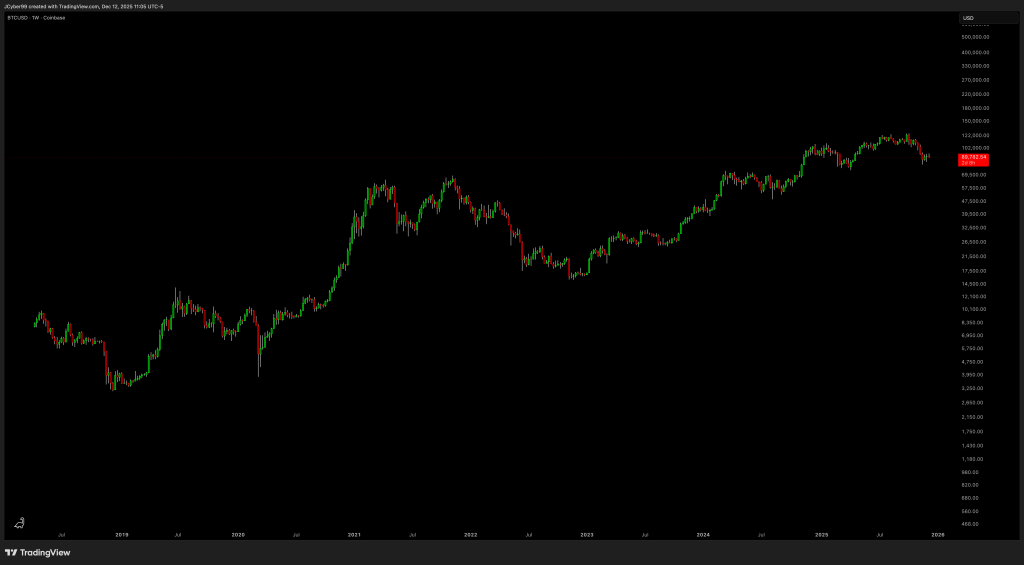
Don’t add indicators. Don’t analyze.
Just notice:
- Price moves up
- Price moves down
- Price pauses
That’s it. Understanding starts with observation, not action.
What Comes Next
Tomorrow, we’ll break down the most basic building block of every chart — the candlestick — and why it exists at all.
This content is for educational purposes only and reflects general market concepts. It is not financial advice.

Leave a comment