Purpose
The purpose of Day 2 is to define the basic unit of a chart.
Yesterday established that a chart is a record.
Today establishes how that record is written.
Before understanding patterns, trends, or structure, it is necessary to understand the single mark that makes up the chart.
That mark is the candle.
Lesson
A Bitcoin chart is made up of candles.
Each candle represents price activity over a specific period of time.
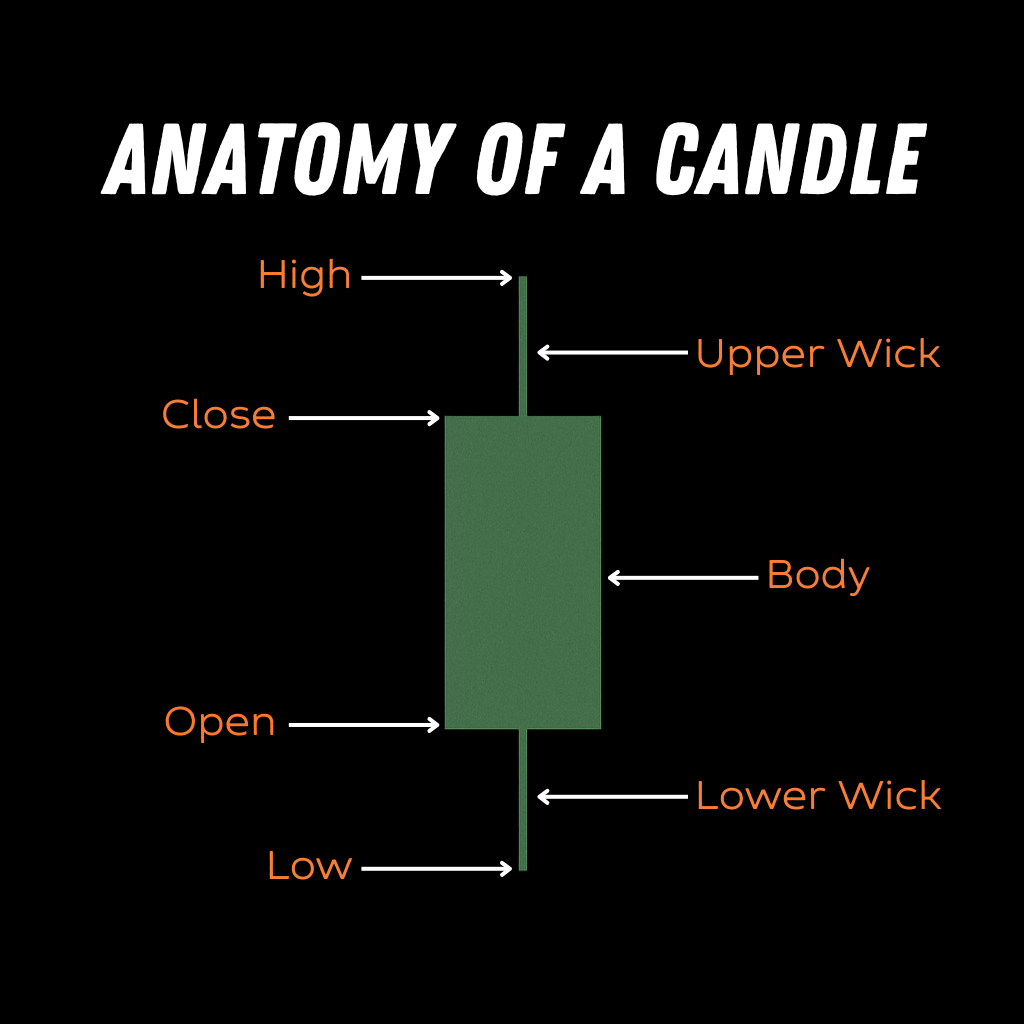
A candle has three main parts:
- the body
- the upper wick
- the lower wick
The body of the candle shows the distance between:
- the opening price
- the closing price
It records where price started and where it finished during that time period.
The body does not explain why price moved. It does not imply what happens next.
It only records the result.
The thin lines above and below the body are called wicks.
- The upper wick records the highest price reached
- The lower wick records the lowest price reached
Wicks show how far price moved beyond the body before the candle closed.
They record range, not intent.
Together, these parts record four facts about price during that period:
- where price opened
- where price closed
- the highest price reached
- the lowest price reached
Nothing else is included.
A candle does not tell you what price should do.
It tells you what price did do.
A common mistake at this stage is assigning meaning too early.
Examples:
- Treating candles as instructions
- Naming patterns before understanding components
- Assuming candles imply direction
At this stage, candles are not tools.
They are records.
Understanding comes from recognizing what is being recorded — not from acting on it.
Practice
Open the same Bitcoin chart you used yesterday.
(https://in.tradingview.com/chart/?symbol=CRYPTO%3ABTCUSD)
Do not add anything. Look at a single candle.
Notice only this:
- Where it opened
- Where it closed
- How high price reached
- How low price reached
- Where the Body ends and the wicks starts
Do not label. Do not interpret. Do not predict.
The practice is observation only.
What Comes Next
Now that you know what a candle records, the next step is understanding how time affects that record.
In Day 3, we’ll look at how the same candle can represent very different information depending on the length of time it covers.

Leave a comment