A 21-Day Guide to Reading Bitcoin Charts

Purpose
The purpose of Day 1 is to establish posture.
Most people open a Bitcoin chart looking for answers about what will happen next.
That habit creates urgency and noise.
Before learning how charts work, this series starts by resetting how they are approached.
Reading comes before reacting.
Lesson
A Bitcoin chart is a record.
It shows how price has changed over time.
That’s it.
The chart does not explain why price moved.
It does not tell you what will happen next.
It simply shows what has already happened.
Learning to read charts begins with seeing them as records — not as instructions, signals, or predictions.
This mindset is the foundation for everything that follows.
A common mistake at this stage is treating the chart as a set of instructions.
When price moves, it can feel like the chart is telling you to do something.
At this point, it isn’t.
The chart is not a command. It is documentation.
Practice
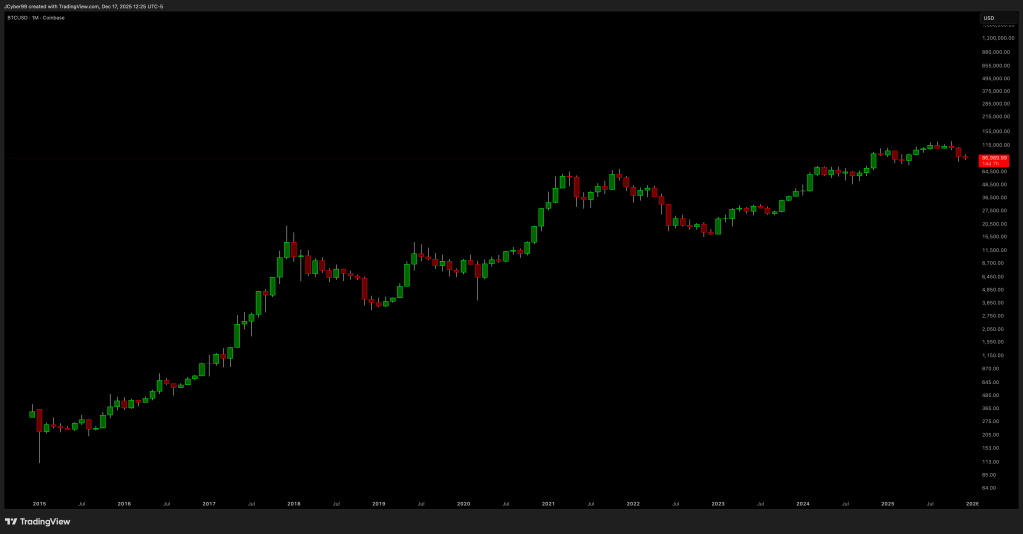
Open a Bitcoin chart.
(https://in.tradingview.com/chart/?symbol=CRYPTO%3ABTCUSD)
Do not add anything to it.
Notice only this:
- price moves
- price pauses
- price changes over time
Do not label, interpret, or predict.
For today, the practice is simply recognizing what a chart is.
What Comes Next
Now that you understand what a chart represents, the next step is to understand how that record is written.
In Day 2, we’ll look at a single candle and identify what data it records during a specific period of time — without assigning meaning or drawing conclusions.

Leave a comment