
The Parable
The traveler continues forward.
He notices the same markers he saw before.
But now, something feels different.
Some stretches of the road are short.
Others feel long and drawn out.
A marker placed on a long stretch tells a deeper story than the same marker placed on a short one. The marker didn’t change.
The time spent reaching it did.
The traveler realizes that without knowing how long the journey took, he only understands part of what happened.
What This Reveals
A candle doesn’t only show movement. It also represents time.
Every candle records what happened during a specific length of time.
The movement may look the same. The meaning does not.
What a Timeframe Is (In Plain Language)
Some candles represent less time. Others represent more time.
A timeframe is simply the amount of time one candle represents.
- A 1-hour candle shows what happened in one hour
- A daily candle shows what happened in one day
Each candle still shows:
- Open
- Close
- High
- Low
Nothing about the candle changes. Only how long price had to move.
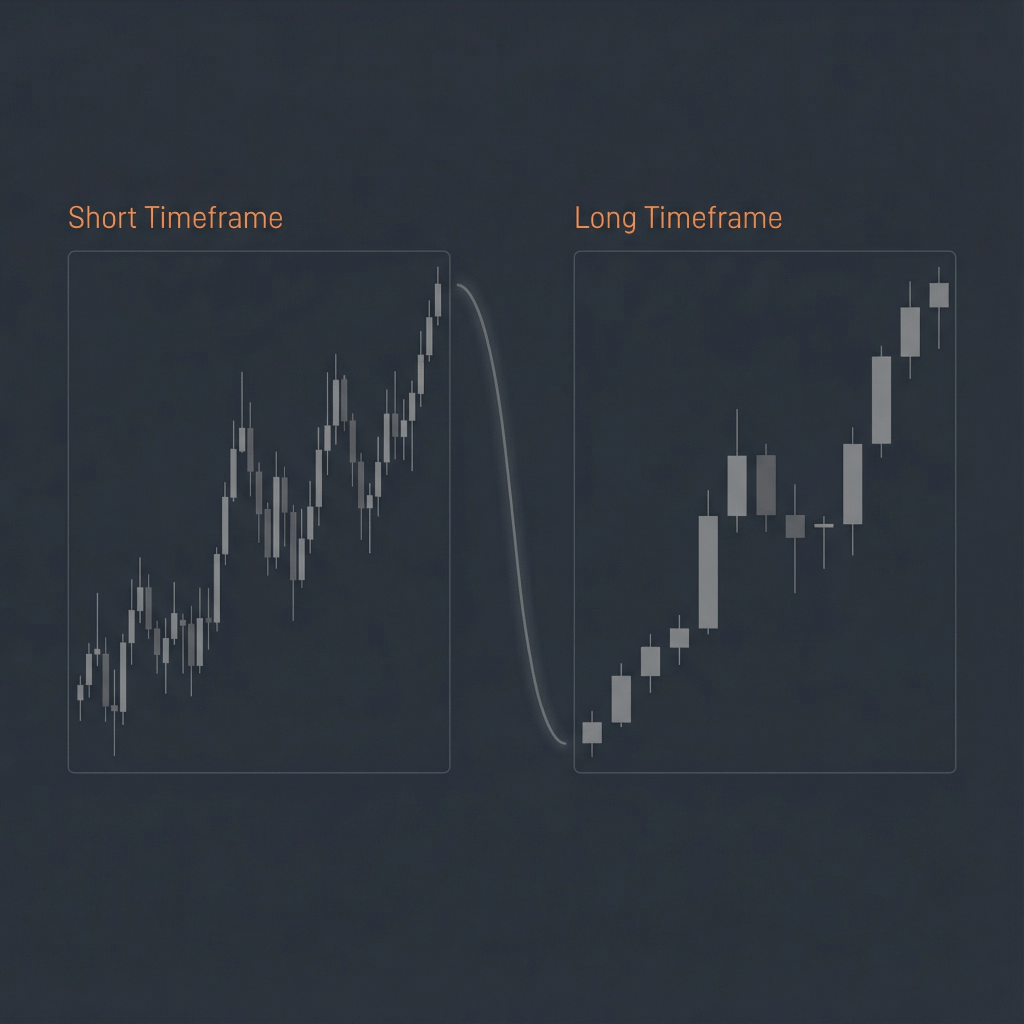
In practice, this is often described as:
- A short timeframe (minutes or hours)
- A longer timeframe (daily or weekly)
Why Timeframes Matter
A price move that happens quickly is not the same as the same move happening slowly.
More time means:
- More participation
- More decisions
- More effort
Time gives weight to movement. Without time, a candle is incomplete information.
A Common Beginner Mistake
Many beginners look at a candle and ask:
“Is this good or bad?”
Before asking that, there’s a simpler question:
“How long did this take?”
Ignoring the timeframe leads to:
- Overreacting to small moves
- Misjudging importance
- Confusion when charts seem to contradict each other
The Practice (Do This Today)
Open your Bitcoin chart.
(https://in.tradingview.com/chart/?symbol=CRYPTO%3ABTCUSD)
Switch between:
- A short timeframe (minutes or hours)
- A longer timeframe (daily or weekly)
Look at the candles.
Notice:
- How movement feels noisy on shorter timeframes
- How it feels calmer on longer ones
- How the same price action tells a different story
Don’t interpret. Just observe how time changes meaning.
What Comes Next
Tomorrow, we’ll look at candle color and shape — what they record, and what they do not tell you.
For now, remember this:
Candles record movement.
Time gives that movement meaning.
This content is for educational purposes only and reflects general market concepts. It is not financial advice.

Leave a comment